

BNB, Sui, and XRP lead crypto gains ahead of the Fed decision. Speculation rises as altcoin interest surges. Exciting times for crypto investors! #Crypto #BNB #XRP
- Introduction
- Tracing the Rise: How XRP, BNB, and Hyperliquid Became Market Leaders
- Deconstructing the Surge: What’s Driving XRP, BNB, and Hyperliquid’s Recent Gains?
- Navigating Hurdles: Challenges Facing XRP, BNB, and Hyperliquid
- The Road Ahead: Future Prospects for XRP, BNB, and Hyperliquid
- Final Thoughts: Understanding the Implications of XRP, BNB, and Hyperliquid’s Rise
Introduction
In the ever-evolving world of cryptocurrencies, a handful of altcoins like XRP, BNB, and Hyperliquid have surged ahead, capturing the attention of traders and investors alike. This rise occurs against the backdrop of a significant monetary policy decision by the U.S. Federal Reserve, expected to ripple across global markets. While some may anticipate cryptocurrencies reacting directly to such macroeconomic events, the recent gains in these altcoins are primarily driven by unique, coin-specific narratives. This article delves into why these particular cryptocurrencies are outperforming, the factors fueling their rise, and what this means for the broader crypto market. We’ll explore their recent performance, the influence of institutional maneuvers, and the implications of a potential spot ETF approval for XRP. Join us as we unpack these developments and provide insights into the future trajectory of these digital assets.
Tracing the Rise: How XRP, BNB, and Hyperliquid Became Market Leaders
In the cryptocurrency landscape, XRP, BNB, and Hyperliquid have emerged as significant players, each carving a niche amidst the volatile market conditions. XRP, known for its role in facilitating cross-border payments, has consistently been at the forefront of the crypto dialogue, especially with its ongoing legal battles and regulatory clarifications providing a clearer path forward. Meanwhile, BNB, Binance’s native token, has seen its utility and value proposition expand beyond being merely a trading fee discount token to a pivotal component of Binance’s comprehensive ecosystem — including Binance Smart Chain, which supports numerous decentralized applications. Hyperliquid, although newer, has captured market interest through innovative technology and strategic partnerships that promise enhanced liquidity solutions within decentralized finance (DeFi).
Historically, the success of these altcoins has been influenced by a combination of technological advancements, community support, and strategic corporate decisions. XRP’s journey is marked by its ongoing commitment to revolutionizing financial transactions, while BNB has leveraged Binance’s extensive reach and influence to foster adoption and integration. Hyperliquid, on the other hand, has quickly adapted to the market’s needs by providing unique liquidity solutions that address gaps in the DeFi space. With each altcoin’s narrative intertwined with broader market trends and regulatory landscapes, their recent performance underscores a shift towards assets with tangible use cases and robust ecosystems.
Deconstructing the Surge: What’s Driving XRP, BNB, and Hyperliquid’s Recent Gains?
The Role of Institutional Investments in Boosting Altcoin Performance
Institutional investors have played a pivotal role in the recent performance of XRP, BNB, and Hyperliquid. The allure of cryptocurrencies as a hedge against traditional financial systems has attracted significant capital inflows, particularly into altcoins with clear utility and growth potential. BNB, for instance, benefits from Binance’s strategic initiatives and the growing adoption of its smart contract platform. The exchange’s ability to navigate regulatory challenges while expanding its ecosystem has positioned BNB as a preferred choice for institutional portfolios seeking diversification.
Similarly, XRP’s appeal partly lies in its utility within the financial sector, enhanced by Ripple’s continuous efforts to establish partnerships with banks and financial institutions globally. The possibility of a spot ETF approval has further heightened interest, potentially paving the way for more institutional participation. Hyperliquid, despite being a newer entrant, has attracted attention through its innovative approach to liquidity provision in DeFi, a sector that continues to see rapid growth and institutional interest.
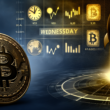
The Impact of Market Sentiment and Speculation
Market sentiment and speculation continue to be significant drivers of price movements in the crypto space. The anticipation surrounding the Federal Reserve’s interest rate decision adds a layer of complexity, with traders speculating on potential outcomes and their impacts on asset prices. For XRP, the buzz around a potential spot ETF approval has fueled speculative trading, with investors eager to capitalize on the anticipated price surge upon approval. BNB’s performance is buoyed by speculation on Binance’s future initiatives and the continued expansion of its ecosystem.
Hyperliquid benefits from its novelty and the speculative interest in DeFi, where traders are constantly seeking the next big project with high growth potential. The rise in open interest in altcoins, as highlighted by market data, reflects an increasing appetite for risk and the potential for significant returns, despite the underlying market volatility. As traders position themselves in anticipation of a favorable outcome from the Fed’s decision, the interplay between sentiment and speculation remains a crucial factor in the dynamics of these altcoins.
Technological Innovations and Ecosystem Developments
Technological advancements and ecosystem developments are integral to the sustained growth of XRP, BNB, and Hyperliquid. Ripple’s ongoing efforts to enhance the functionality and scalability of XRP have positioned it as a leader in cross-border payment solutions. The development of new features and partnerships with financial institutions bolster its use case, driving adoption and investment interest.
BNB’s growth is tied to Binance’s relentless pursuit of innovation, with the Binance Smart Chain playing a central role in fostering a vibrant ecosystem of decentralized applications. The chain’s compatibility with Ethereum and lower transaction costs have attracted developers and users alike, contributing to BNB’s robust performance.
Hyperliquid’s approach to liquidity solutions in DeFi represents a technological leap, addressing key challenges in decentralized finance. By providing efficient liquidity mechanisms, Hyperliquid enhances the user experience and attracts more participants to the DeFi ecosystem. These technological strides not only drive current performance but also set the stage for future growth and adoption.
Despite their recent successes, XRP, BNB, and Hyperliquid face several challenges that could impact their growth trajectories. Regulatory scrutiny remains a significant concern, particularly for XRP, which has been embroiled in a legal battle with the U.S. Securities and Exchange Commission (SEC). The outcome of this case could set a precedent for how cryptocurrencies are classified and regulated, influencing not only XRP but the broader market.
For BNB, the challenge lies in maintaining its position amidst increasing competition and regulatory pressures on Binance. As global regulators tighten their grip on cryptocurrency exchanges, Binance must navigate these challenges while continuing to innovate and expand its offerings. Hyperliquid, although promising, faces the inherent risks associated with being a newer project in the highly competitive DeFi space. Ensuring security, scalability, and user adoption are critical hurdles that Hyperliquid must overcome to sustain its growth and attract long-term investment.
The Road Ahead: Future Prospects for XRP, BNB, and Hyperliquid
Looking forward, the future of XRP, BNB, and Hyperliquid is filled with potential and challenges. XRP’s trajectory will largely depend on the resolution of its legal issues and its ability to continue forging partnerships with financial institutions. The approval of a spot ETF could serve as a catalyst for renewed interest and investment.
BNB’s future is tied to Binance’s strategic direction and its ability to adapt to regulatory landscapes while fostering innovation within its ecosystem. The expansion of Binance Smart Chain and its integration with other blockchain projects could further enhance BNB’s utility and market position.
Hyperliquid’s prospects hinge on its ability to deliver on its promises of enhanced liquidity solutions and to capture a significant share of the DeFi market. Continued innovation and strategic partnerships will be crucial in navigating the competitive landscape and establishing Hyperliquid as a mainstay in the crypto community.
Final Thoughts: Understanding the Implications of XRP, BNB, and Hyperliquid’s Rise
In conclusion, the recent rise of XRP, BNB, and Hyperliquid reflects the complex interplay of technology, market sentiment, and institutional interest in the cryptocurrency space. While each of these altcoins faces unique challenges, their robust ecosystems and strategic innovations position them for continued growth. Investors and traders should remain vigilant, considering both the opportunities and risks associated with these digital assets. As the market evolves, the ability to adapt and innovate will be key to sustaining momentum and capturing value in the ever-changing landscape of cryptocurrencies.